
The following two charts indicate that it’s time to seriously considering adding to OR initiating new equity long positions:
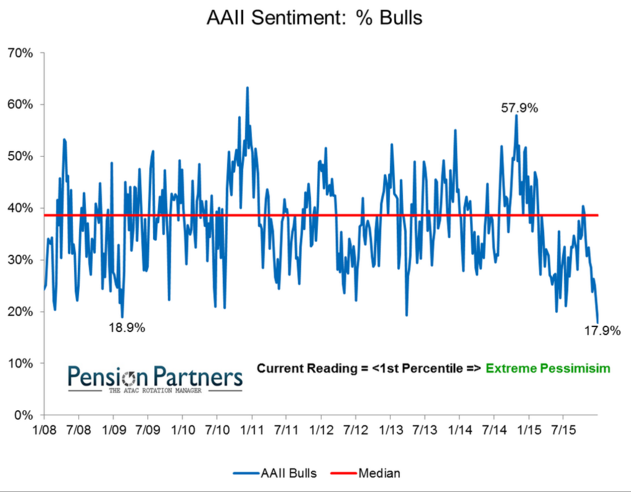
The AAII % Bulls is currently below where it was at the 2009 low; this speaks volumes as to the level of negativity that is currently percolating across equity markets.
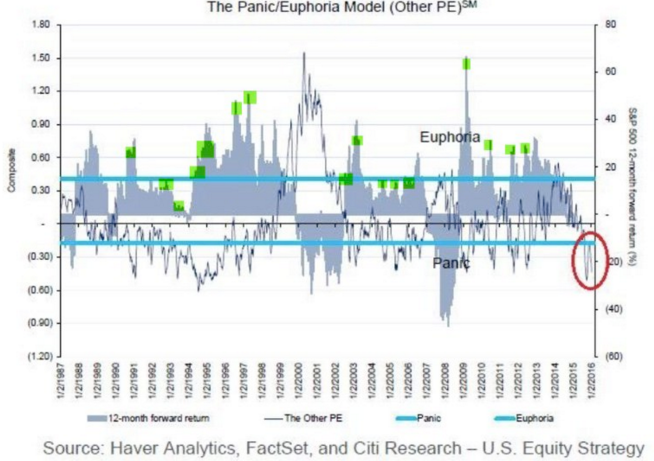
Meanwhile Citi’s Panic/Euphoria Model is at its highest levels of panic since the 2008/2009 Global Financial Crisis:
The stage is set for a snap-back relief rally which in the case of the high-beta Russell 2000 could easily be quite substantial in terms of magnitude (~10%):
IWM (Weekly)
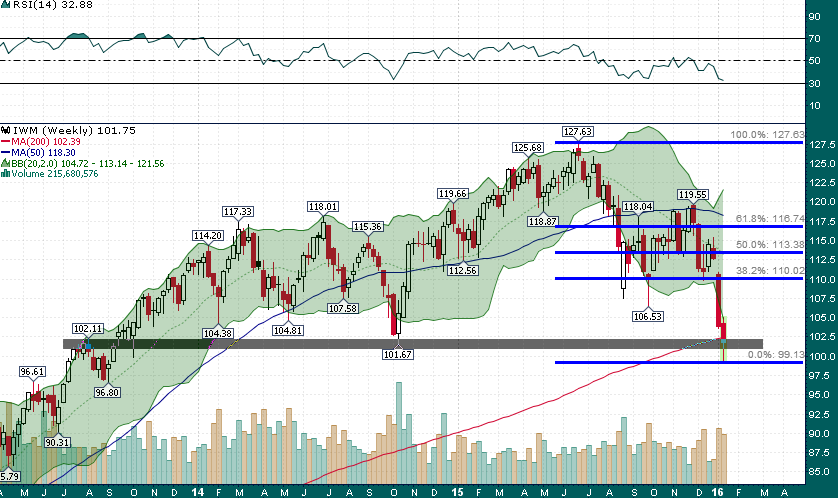
A weekly close above previous support near ~$102 could set the stage for a failed breakdown (yesterday and this morning) and an ensuing short squeeze/relief rally. A 38.2% retracement of the ~22% decline from the July high would equate to a rally back up to ~$110.
The most bearish scenario longer term would be a range-bound consolidation near long-term support (~$102) which would likely just be setting up the next leg lower. The finish to this tumultuous week will offer a lot of clues and investors/traders will want to pay close attention.