
Daily Commodity Chart Wrap 3/3/2015:
S&P 500 vs. Brent Crude Oil Since 2008
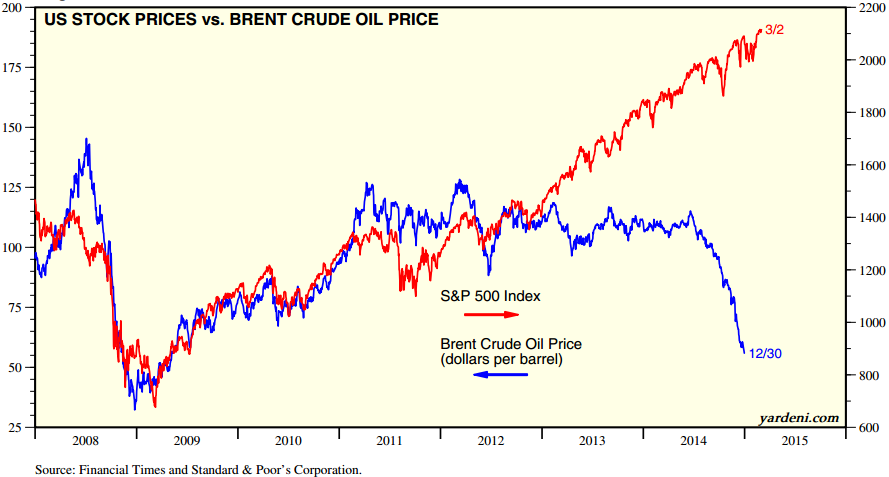
After being positively correlated during the 2008-2012 time period, Brent crude oil and US equities have markedly diverged in the past couple of years
Gold (Daily)
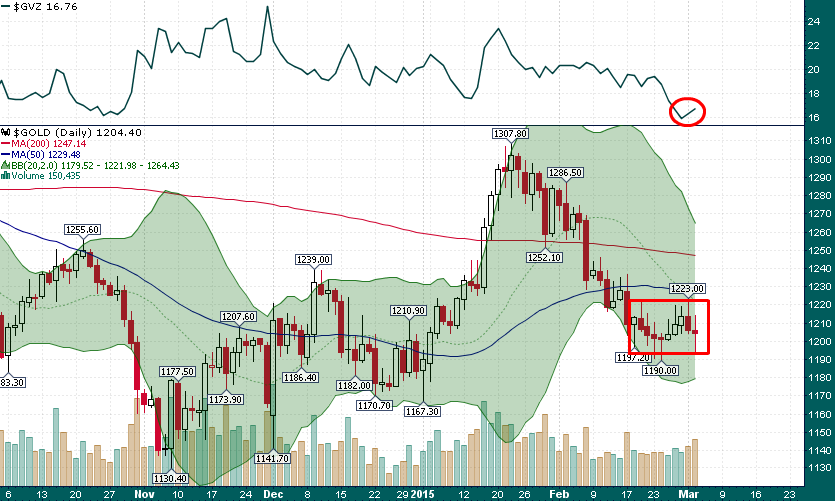
Gold continues its messy oscillation around the $1200 psych level. Today’s $20 range formed a relatively large bodied spinning top candlestick. The recent upturn in GVZ (CBOE Gold Volatility Index) may be foreshadowing that a large directional move is imminent. Resistance: $1220, $1240 Support: $1200
% of Country’s Total Exports Consumed by China
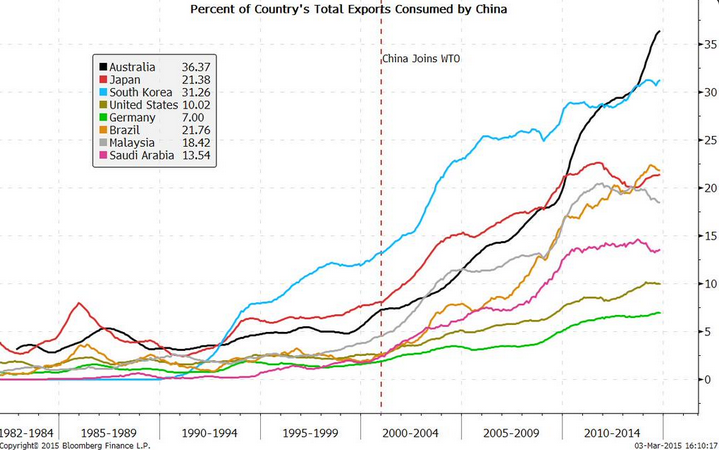
Australia is by far the country most leveraged to China
WTI Crude Oil (Daily) with implied (above) and realized volatility (below)
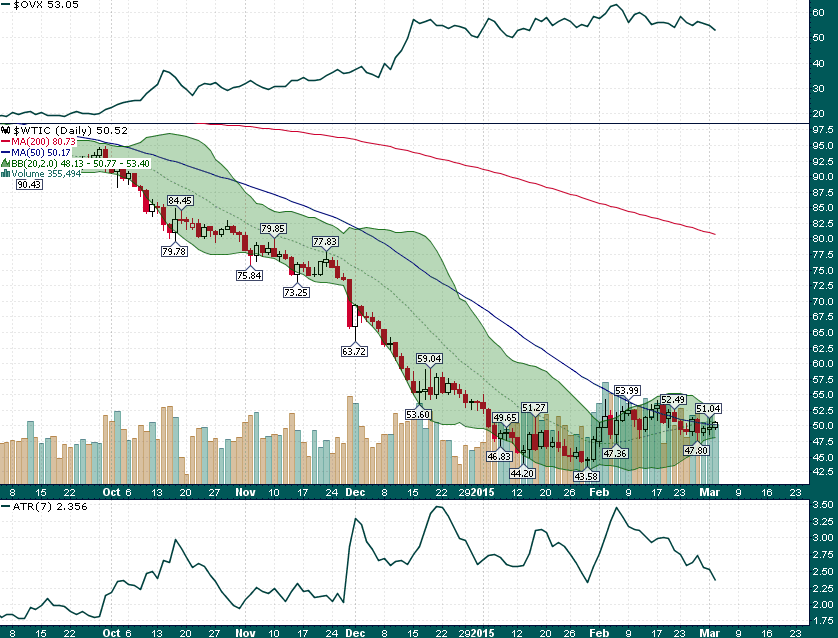
WTI crude continues to tightly gravitate to $50/barrel (50-day moving average) as realized volatility collapses. Interestingly enough implied volatility (OVX) remains at extraordinarily elevated levels.