
This week’s copper performance certainly isn’t in agreement with the theory that economic growth is stalling. In fact, during Wednesday’s session copper broke out from a multi-month head & shoulders bottom pattern:
Copper (Daily)
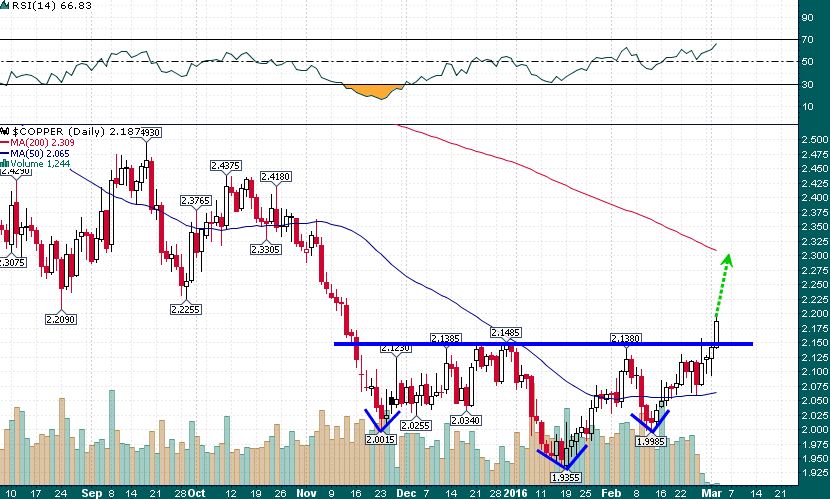
The breakout from this pattern targets over $2.30/lb which happens to roughly coincide with the falling 200-day simple moving average, a moving average which copper hasn’t touched in nearly a year.
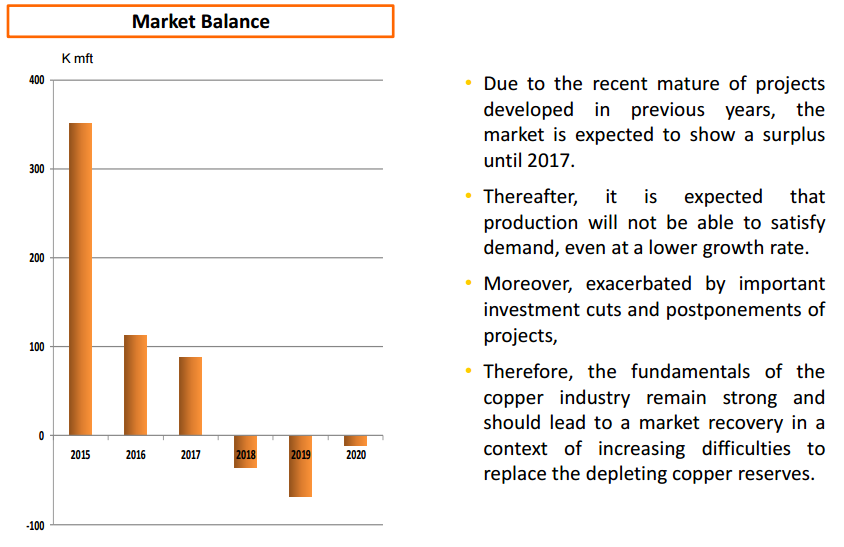
Meanwhile, a presentation by Codelco at the BMO Global Metals & Mining Conference helps to illustrate that the copper market is in the midst of a transition from being in gross surplus last year to a significant deficit in 2018 & 2019:
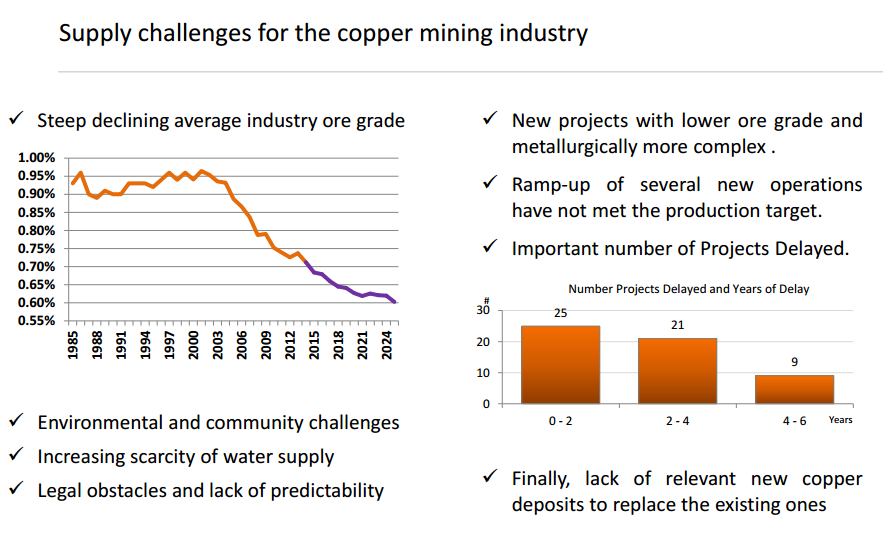
Average ore grade in copper mining has declined steeply over the last decade and is expect to decline ever further over the next decade:
While it would not be surprising at all to see the copper price retest back below $2/lb before the ultimate bottom is in place, there are strong indications that copper’s worst days are behind it.