
Gold producers’ cash costs are still well below the current price of gold with the 90th percentile of costs coming in just above $800/ounce:
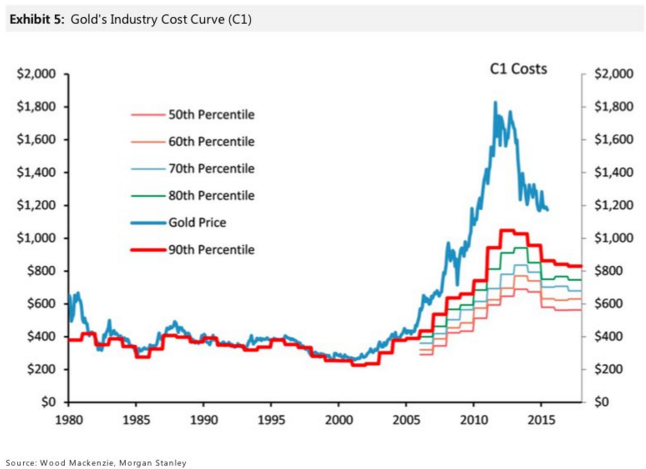
Notice how the gold price tracked the 90th percentile of cash costs very closely for roughly twenty years between the early 80s and the early 2000s. The secular gold bull market that began in 2001 clearly unhinged this relationship, however, if gold has indeed succumbed to a long term bear cycle then one could expect this relationship between producer cash costs and the underlying commodity to resume.
It is important to note that cash costs are distinct from all-in costs. All-in costs are much higher (currently above $1,000/ounce for many of the major gold miners) because they include exploration expenses, management office costs, and sustaining capital in addition to the cost of production at the mine site. Whereas, cash cost is simply the cost of production at the mine site.
This is important to understand because once a mine is built and the infrastructure has become a sunk-cost the firm will continue production as long as the price of the metal is above the cash cost. Brent Cook recently published a must read article for any serious mining investor on this topic: The Terrible Truth of Gold Mining Cost Reporting.