
Among other market developments in 2016 we have seen a breakdown in the spread between the 2-year treasury note yield and the 10-year treasury note yield:
2s/10s spread (gold below)
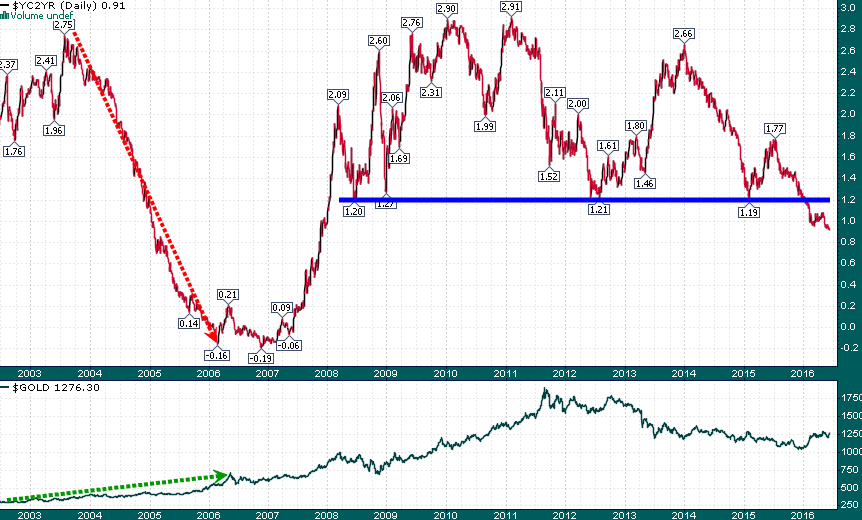
The last time that the yield curve flattened significantly (2003-2006) precious metals launched into one of the most bullish phases in precious metals history. The spread between the yield on the 2-year and 10-year Treasury notes is the narrowest it has been since 2007 and if we think back to the 2005 time frame the flattening yield curve turned out to be a bearish omen of what was to come in terms of the U.S. Housing Crisis and the Global Financial Crisis.
While we may not know what the flattening U.S. Treasury yield curve may be signalling, we can know for certain that a flatter yield curve and lower (and/or negative) real interest rates are bullish for precious metals.