This Chart Indicates That Gold Could Be Close To A Big Move

posted in: Charts, Gold, Gold Stocks | 0

The yield on the 10-year U.S. Treasury note has been coiling since making a low in February:


10-year U.S. Treasury Yield (gold/10-year yield correlation below)


TNX_Gold

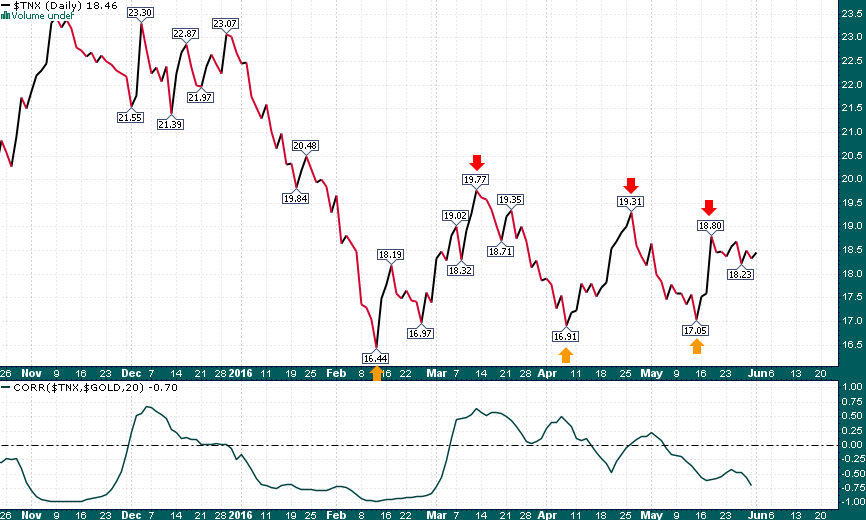
It is likely that the series of lower highs and higher lows which have occurred since February will come to an end over the coming weeks with either an upside move above 1.88% or a breakdown below 1.70%.

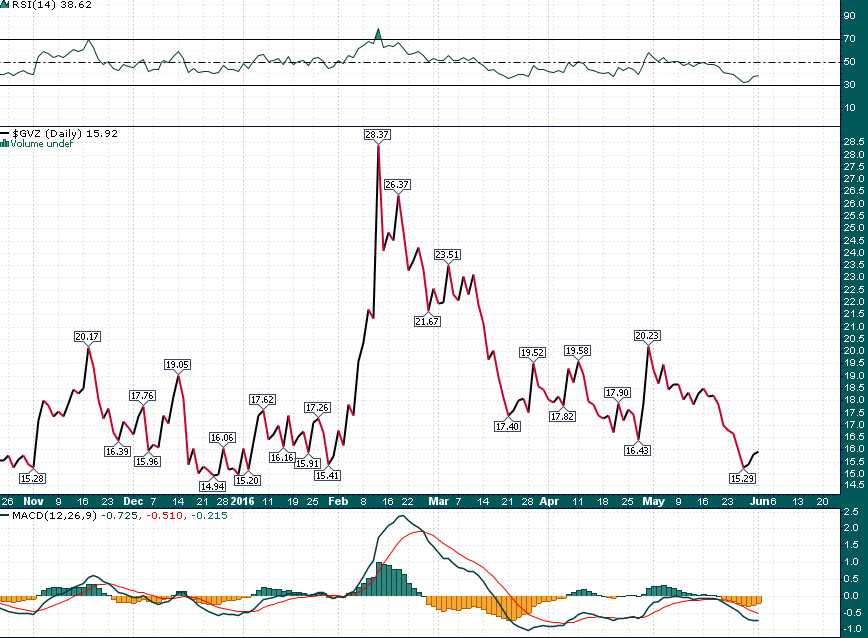
Considering that the correlation between Treasury yields and gold are running at the highest levels since February a resolution to the coil in 10-year note yields could also result in a big move in gold. With the GVZ (gold implied volatility index) at relatively low levels a volatility trade in gold using GLD options is becoming quite tempting.


GVZ_Daily_6.1.2016

Click the PayPal button below to sign up for the CEO Technician Premium Service and receive our daily market email updates and gain access to the Trading Lab with real time trade updates and market analysis:


CEO Technician Premium Subscription Options


Disclaimer
This publication is provided for informational and entertainment purposes only and is not a recommendation to buy or sell any security. Always thoroughly do your own due diligence and talk to a licensed investment adviser prior to making any investment decisions. Junior resource companies can easily lose 100% of their value so read company profiles on www.SEDAR.com for important risk disclosures. It’s your money and your responsibility. EnergyandGold.com, EnergyandGold Publishing LTD, its writers and principals are not registered investment advisors and advice you to do your own due diligence with a licensed investment advisor prior to making any investment decisions. We reserve the right take a long or short position in this stock or any other stock we write about without notification to our readers.