
The backdrop for U.S. housing is a mixed one. On one hand mortgage rates remain historically low and show no signs of rising anytime soon, and on the other hand existing home sales have begun to drop off recently and the homeownership rate is in the midst of a 10-year downtrend that shows little sign of abating…
- Single-family construction has barely recovered from the housing bubble, whereas, multifamily housing starts are above pre-recession levels:

- Existing home sales have slumped in recent months:

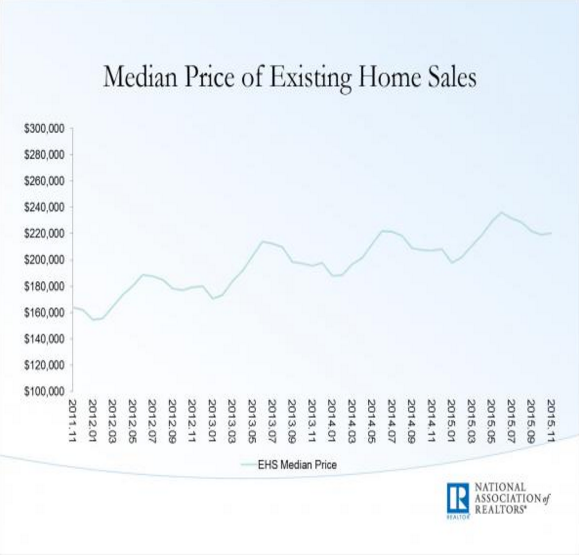
- The median price of existing home sales peaked earlier in the year and has since leveled off:
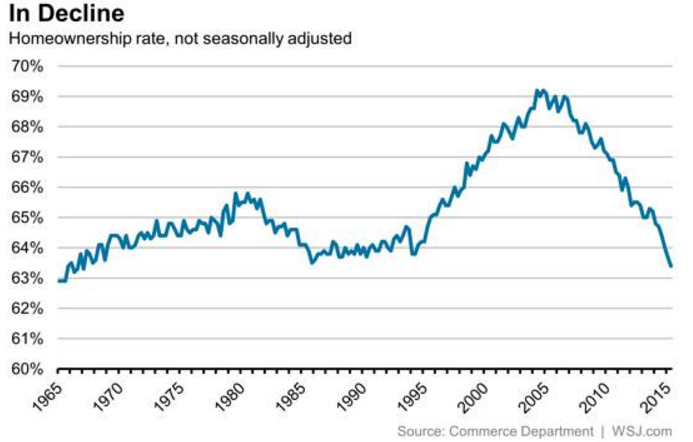
- The homeownership rate in the U.S. is at its lowest level since the 1960s and the downtrend shows little sign of abating:
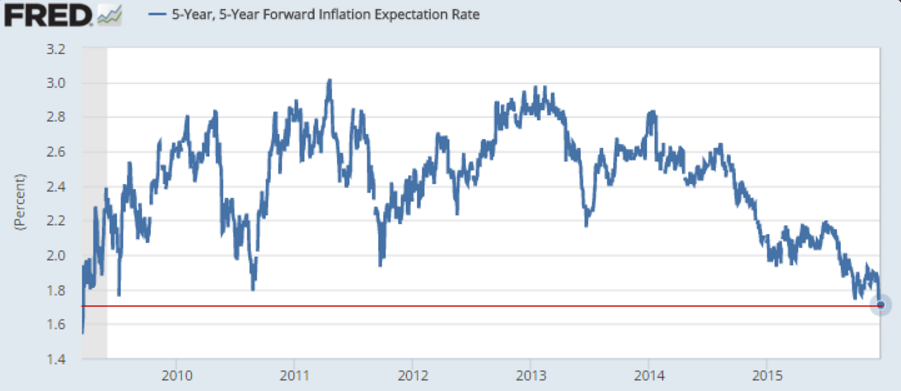
- Inflation expectations remain low which is supportive of mortgage rates remaining at current levels or even moving lower:
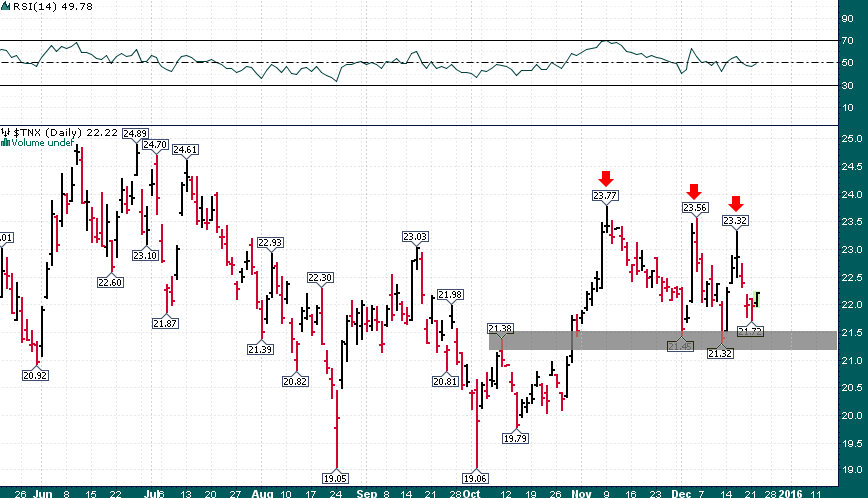
- The 10-year Treasury Note yield has been making lower highs since peaking in November – A break below key support at the 2.13% yield level would set the stage for another leg lower in yields. The 10-year note yield is the key reference rate for mortgage rates. Despite last week’s rate hike by the Federal Reserve there are no signs that mortgage rates will be rising significantly anytime soon:
Co-authored with Maggie Sadowska of Mega Lux Homes