
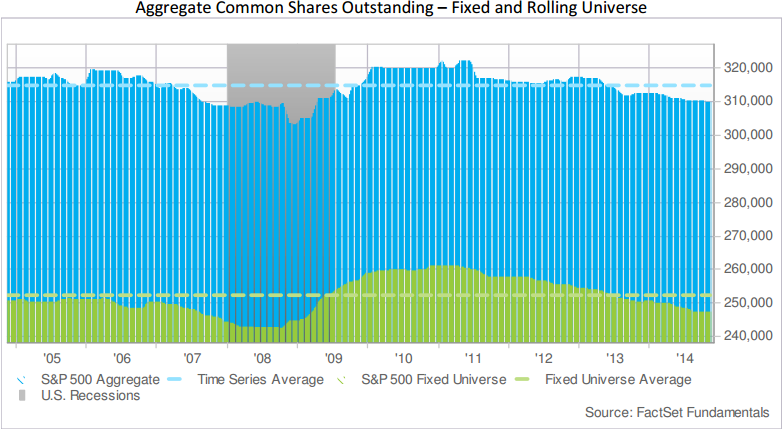
The main driver of the US equity bull market and the recent slew of all-time highs has undoubtedly been corporate stock buybacks. Nearly 3/4 of S&P 500 companies (72%) participated in share buybacks during the 4th quarter of 2014 and the total dollar amount of share buybacks was the 2nd largest ever, second only to 2007 (the year the market topped). The buyback binge of the past few years has served to hoover up shares outstanding and shrink the supply of shares available for return hungry investors to purchase:
This phenomenon has undoubtedly served to help elevate share prices, however, there are mounting signs that the buyback bubble is losing momentum:
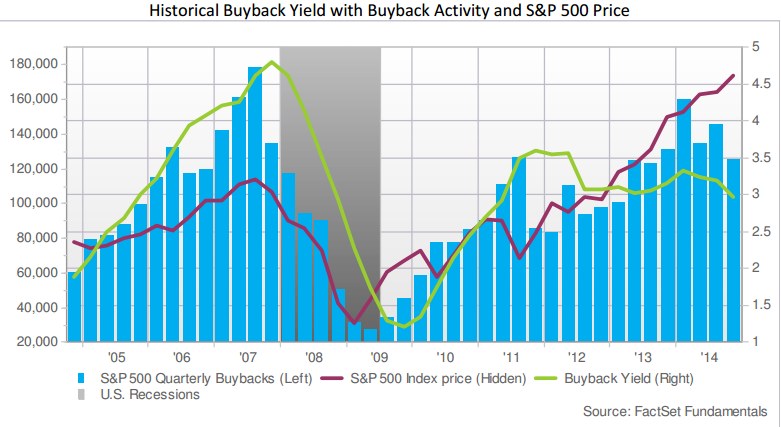
The buyback yield (the total shares repurchased by the company during the last 12 months divided by the company’s current shares outstanding) has been in a downtrend since peaking in 2011 and the total dollar amount of buybacks has been trending lower since Q1 2014. The most interesting aspect of the above chart is the fact that the S&P 500 has continued moving higher despite the waning momentum of buybacks. Whereas, in 2007 the market topped during the exact quarter (Q3 2007) that buybacks peaked.
Click over to read the entire quarterly buyback report from FactSet: Factset Buyback Quarterly 3.16.2015