
While the CFTC Commitments of Traders Report is far from an exact market timing tool, it does offer one of the best gauges of market positioning and sentiment. After Tuesday’s sell-off speculative positioning fell to a level of net length that has more often than not coincided with major lows:
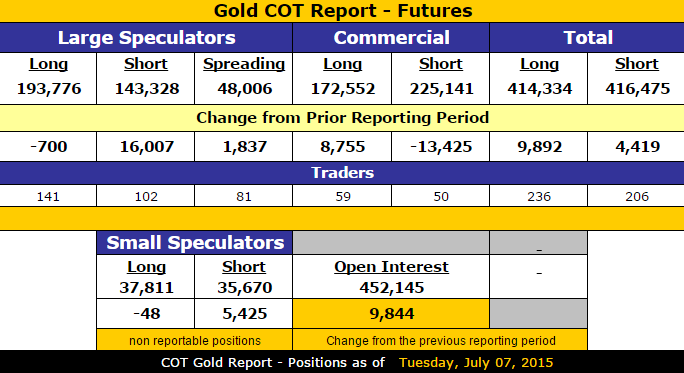
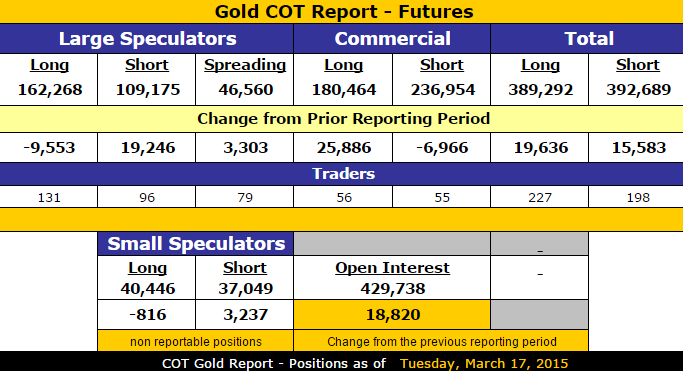
With a sizable spike in speculative short positions (both large & small specs) net speculative length actually fell below the March lows:
Moreover, the last time the commercials were at such a small net short position was at the November lows:
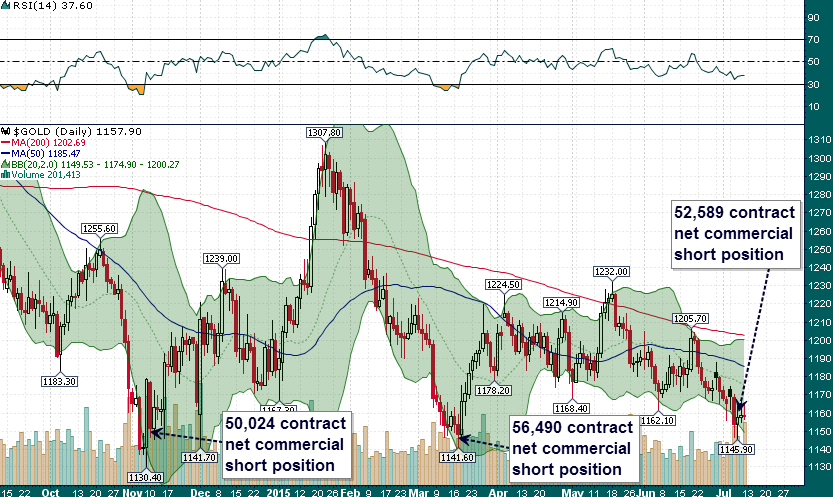
Given the fact that gold remains in a downtrend on multiple time-frames the yellow metal remains “guilty until proven innocent”. While the CoT data is certainly constructive, gold needs to rise above and hold above the $1175 level for us to become truly optimistic that a tradable rally is underway.
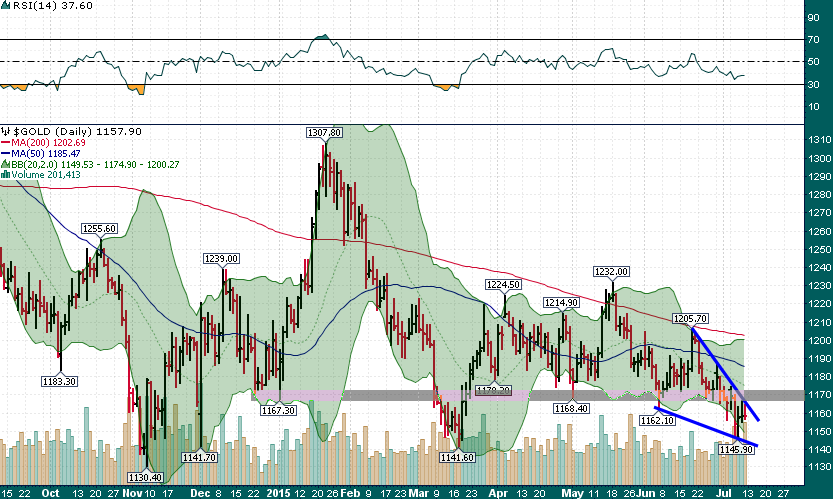
A couple of bullish takeaways from last week’s price action in gold:
- Gold once again found support below $1150 and put in another higher low (relative to the November low)
- Speculators’ long positions have been largely liquidated in recent weeks and bulls are less numerous than they have been at any time since the November low
A couple of bearish takeaways from last week’s price action in gold:
- Gold didn’t catch much of a ‘safe-haven’ bid despite an ample amount of global turmoil (China, Greece, etc.)
- Gold couldn’t hold above $1170 even after Shanghai stocks rallied late in the week (Chinese margin calls were blamed for some of the commodities carnage early in the week)