
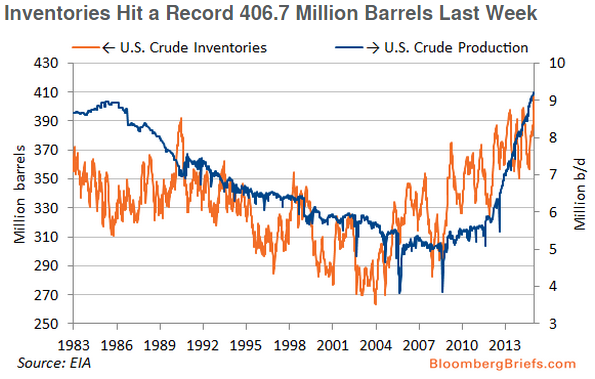
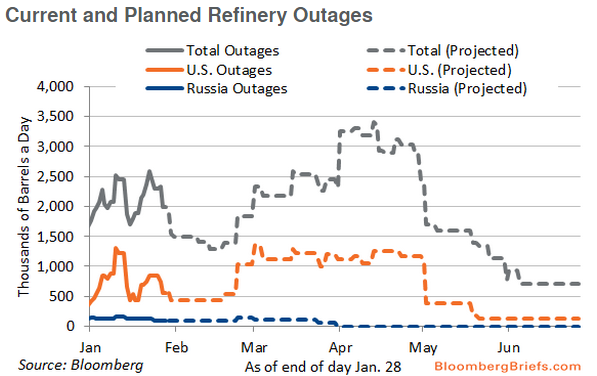
US crude inventories are at record highs and production is at the highest levels in several decades. Meanwhile, refinery outages (both planned and unplanned) are helping to put a crimp in near term demand – from Bloomberg Briefs:
This market dynamic helps to explain the current structure of the crude oil futures curve which is in one of the steepest contangos in history:
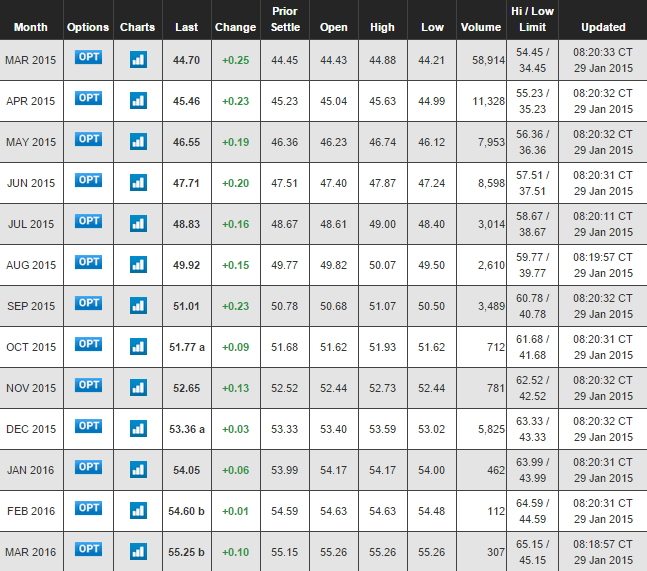
(via CMEGroup.com – the March 2016 contract is trading ~23% above the front month March 2015 contract)
While the situation looks quite gloomy for crude over the near term, one must remember that supply overhangs can correct quickly through lower prices. Moreover, we haven’t seen a significant supply disruption in quite a while. Futures markets are forward looking and can adjust in lightning speed, the first sign that the current supply imbalance is on the verge of correcting should bring about a swift short-covering rally.