
Simple is usually more effective. The following line chart of GDX simplifies things and highlights the important stuff (trend and relative strength):
GDX (Daily)
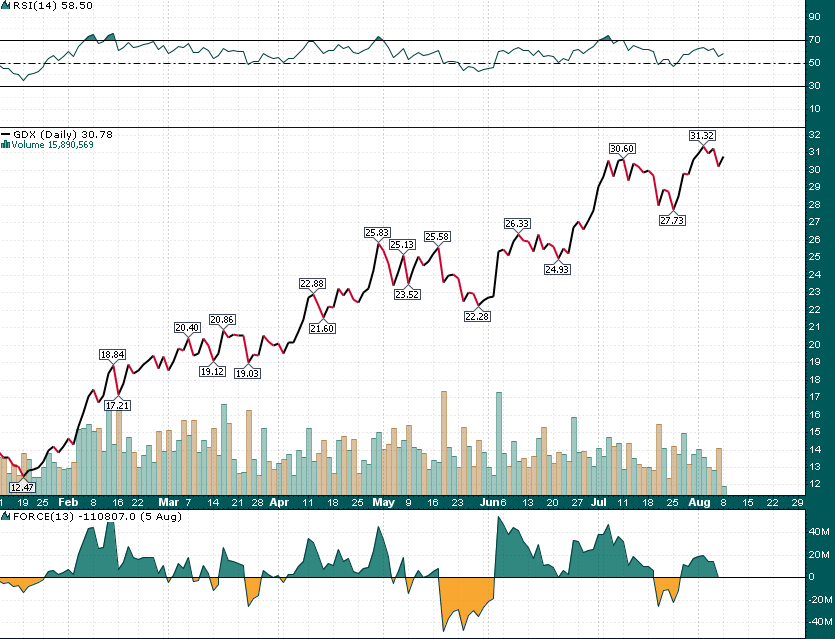
Important observations from this chart:
- Trend is clear, from the lower left to the upper right.
- Relative strength (RSI-14) has almost always stayed above the median line since crossing back above it in late January.
- GDX has only experienced one significant bout of selling this year (late May) while accumulation has been steady, and at times, vigorous.
DISCLAIMER: The work included in this article is based on current events, technical charts, and the author’s opinions. It may contain errors, and you shouldn’t make any investment decision based solely on what you read here. This publication contains forward-looking statements, including but not limited to comments regarding predictions and projections. Forward-looking statements address future events and conditions and therefore involve inherent risks and uncertainties. Actual results may differ materially from those currently anticipated in such statements. The views expressed in this publication and on the EnergyandGold website do not necessarily reflect the views of Energy and Gold Publishing LTD, publisher ofEnergyandGold.com. This publication is provided for informational and entertainment purposes only and is not a recommendation to buy or sell any security. Always thoroughly do your own due diligence and talk to a licensed investment adviser prior to making any investment decisions. Junior resource companies can easily lose 100% of their value so read company profiles on www.SEDAR.comfor important risk disclosures. It’s your money and your responsibility.