
Apple (AAPL) has completed a ‘diamond bottom’ chart pattern with a measured move target of ~$104:
AAPL (Daily)
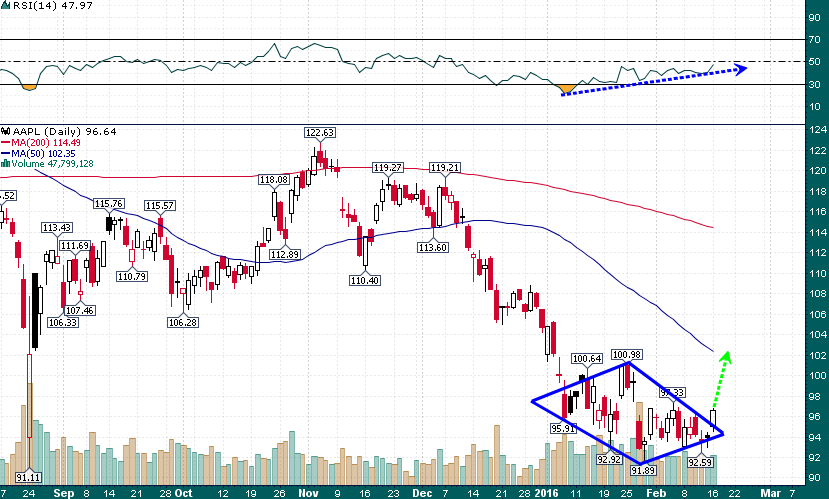
The open gap at $102.16 which roughly coincides with the falling 50-day simple moving average and previous support is the initial upside target. This diamond bottom pattern breakout would be nullified on a close back below $94 which sets up a very clean and attractive risk/reward setup for a trade.