
While some may be quick to point out that the S&P 500 is barely more than 10% from its all-time high reached last summer, the damage beneath the surface and across global equity markets is extensive. More than $17 trillion has been erased from global equity market capitalization since last April:
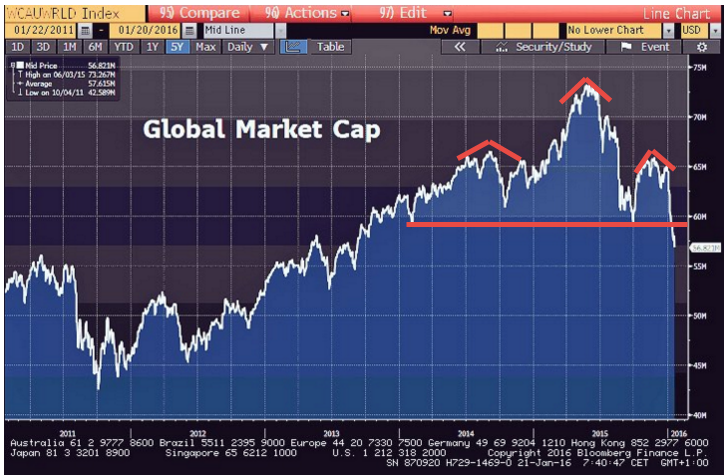
One can also clearly see the head & shoulders top pattern which formed during 2014/2015 in the above chart and the decline to begin 2016 appears to have breached the neckline of this topping pattern. Ominous.
Protracted market declines are always more damaging for sentiment and economic activity than seems appropriate for the magnitude of the decline. After all we’re only back to 2013 global equity market capitalization levels. However, the problem lies in the fact that corporations begin borrowing and raising capital based upon the previous higher valuations and investors absorb these securities and often begin to leverage against them. Deeper, protracted market declines trigger deleveraging cycles which discourage capital formation and thus economic growth because investors have been recently absorbing losses and are not motivated to take on new risk.
We are already seeing the recent market decline and resulting deleveraging take a toll on economic growth forecasts:
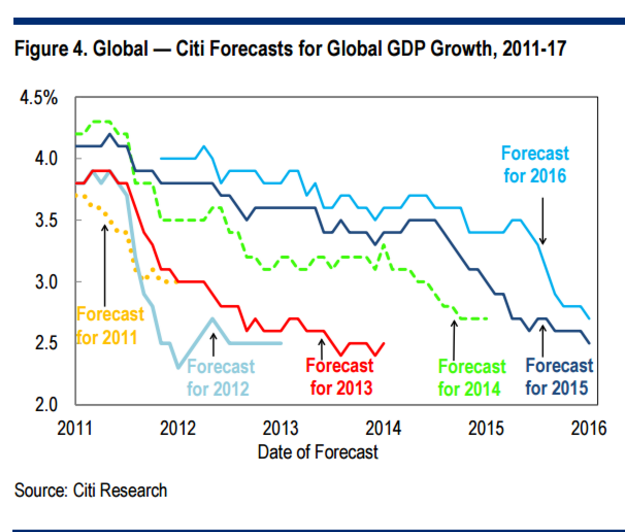
If the current market decline goes much deeper and/or much longer a U.S. recession which will become a certainty instead of a possibility. Most emerging market economies are already either deep in recession or entering recession, it would be quite remarkable if the U.S. managed to sustain growth while the headwinds are mounting all around.