
Thus far 2015 can be dubbed ‘the great oscillation’. We have seen some wild sentiment swings and a tremendous amount of rotation and bifurcation underneath the surface of the major equity indices. However, the S&P 500 has essentially gone no where since New Year’s Eve:
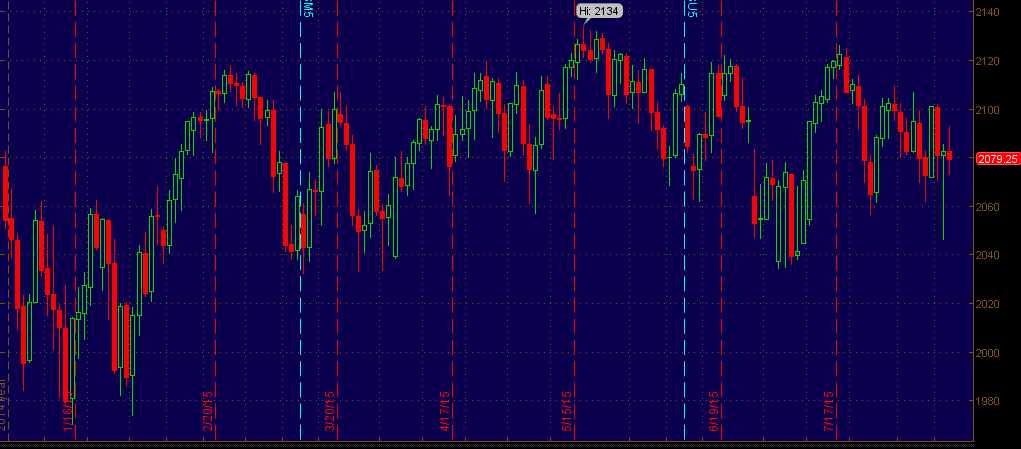
Through all the backstories, noise, and over-analysis the largest US equity index has experienced zero net change since New Year’s Eve 2014.
A brilliant chart courtesy of Bespoke highlights just how messy 2015 has been:
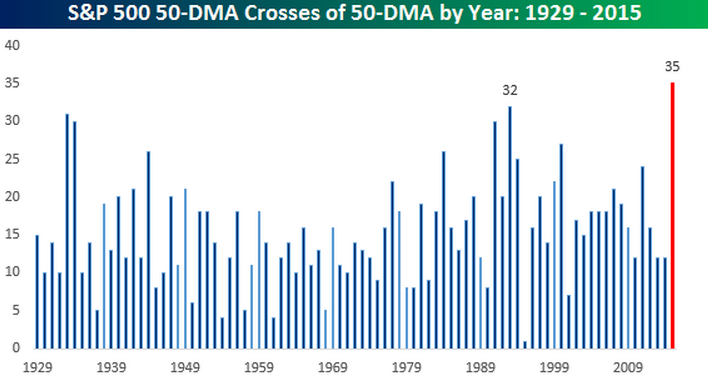
The 50-day simple moving average (an important measure of short term trend) has been flat for much of 2015 and the S&P has crossed this moving average a record 35 times already this year and we still have more than 4 months left!
We will have to see if the great oscillation resolves itself over the coming months or if 2015 will go down in the history books as the messiest range-bound year in the history of the stock market.