
Daily Commodity Chart Wrap 3/5/2015:
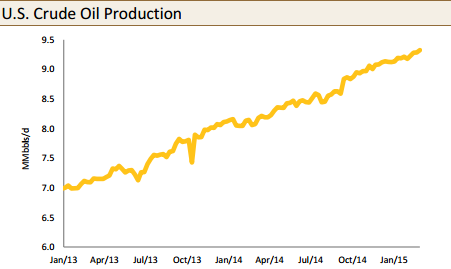
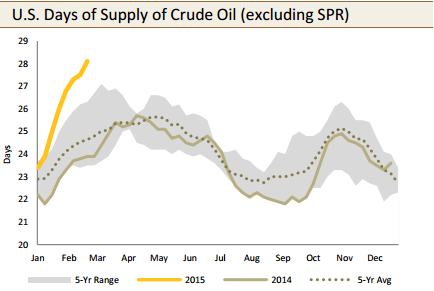
A couple of crude oil charts that demonstrate U.S. production and supply are showing no signs of let up despite a major drop off in rig counts:
We are currently at record levels of US crude oil supply:

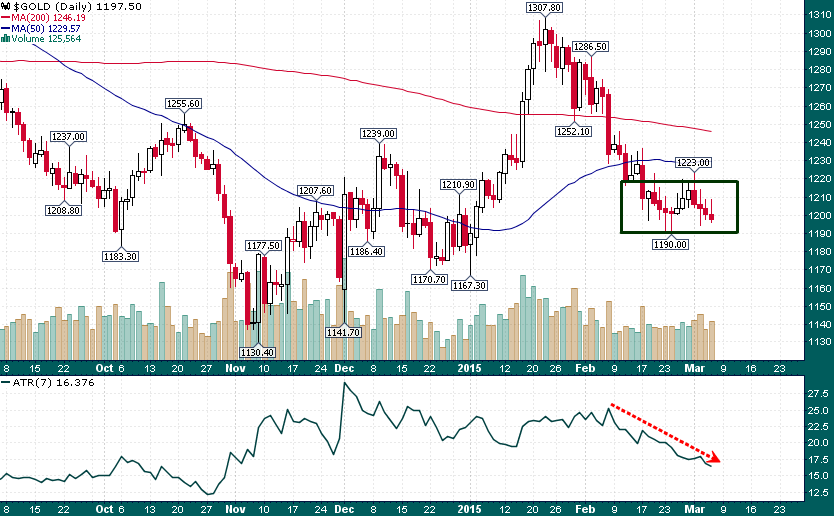
Meanwhile, the “golden box” continues as gold remains rangebound with $1200 acting as a magnet:
And wheat breaks the previous double-bottom to the downside, the 2009-2010 lows near 430 appear to be next:
