
We have highlighted many head & shoulders bottom patterns during the past few months as oil and precious metals stocks have bottomed and begun to turn higher. I want to go into a bit more detail explaining the H&S bottom pattern, some of the theory and psychology behind it, and more importantly how to trade it.
The H&S bottom is one of the stronger bottoming patterns with 74% of H&S bottom breakouts meeting their measured move price targets according to Bulkowski. Here is an excerpt from stockcharts.com on the H&S bottom:
“The price action forming both Head and Shoulders Top and Head and Shoulders Bottom patterns remains roughly the same, but reversed. The role of volume marks the biggest difference between the two. Generally speaking, volume plays a larger role in bottom formations than top formations. While an increase in volume on the neckline breakout for a Head and Shoulders Top is welcomed, it is absolutely required for a bottom.”
So volume is key to indicating the quality of the breakout above the neckline. I would also add that signs of accumulation (higher volume up days) on the right shoulder and in the days leading up to the breakout also makes a H&S bottom breakout setup stronger. The symmetry of the H&S bottom pattern is also important. I am not a huge advocate of slanted necklines or H&S bottoms that do not have symmetry.
There is a H&S bottom pattern that is currently forming on a well known senior gold producer, ABX:
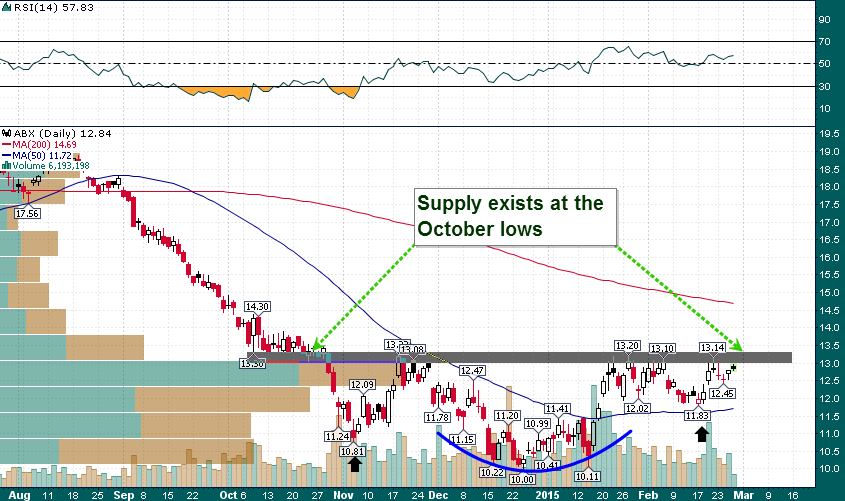
This pattern is virtually symmetrical, the pattern is mature (roughly 4 months in the making), and the neckline is clearly defined ($13.20-$13.40). The theory is that a breakout above the neckline in the next couple of weeks should lead to a further rally to $15+.
The H&S bottom neckline also excellently illustrates the fundamental technical analysis concept of previous support turning into resistance. Notice that support from October near $13.30 has turned into resistance. This concept is easy to understand, previous buyers who had 20%+ losses just last month now have an opportunity to exit their positions at break-even.
Markets have a strong tendency to move toward pockets of supply as they move higher. Once the supply is gobbled up around the neckline of the H&S bottom pattern, the buying inertia should take price to the next pocket of supply. This is the theory and the theory has worked very well in practice. However, one must remember that not all H&S bottoms are made equally and the volume during the breakout is a crucial ingredient.
We will follow this setup in ABX closely over the coming days and update readers accordingly.