
Last week was a brutal start to the year for equity markets with the S&P 500 falling nearly 6% and the small-cap Russell 2000 shedding nearly 8% in a single week. The longer term structural damage inflicted by last week’s decline was extensive, however, given that equities are significantly oversold and the small cap Russell 2000 is very close to long-term support/resistance and the rising 200-week moving average we can expect a bounce in equities early next week:
IWM (Weekly)
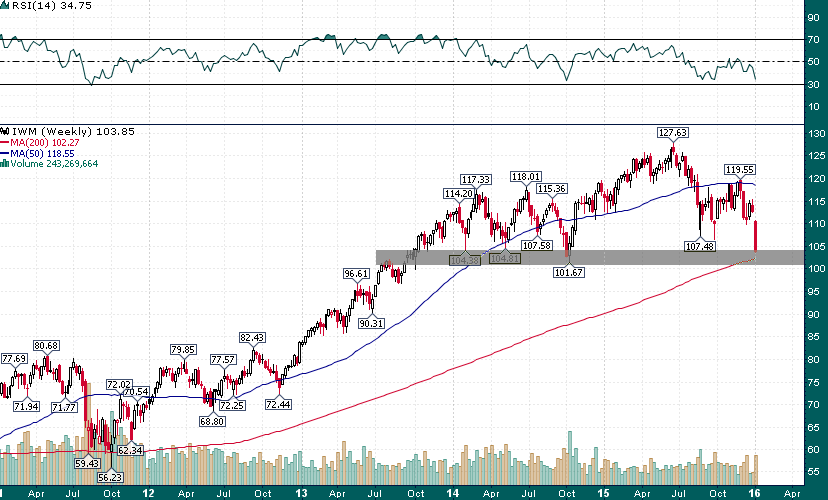
The ~$102-$104 area represents major support/resistance especially given that this area lines up with the first test of the rising 200-week moving average since small caps broke out to the upside at the end of 2012.
SPY (Weekly)
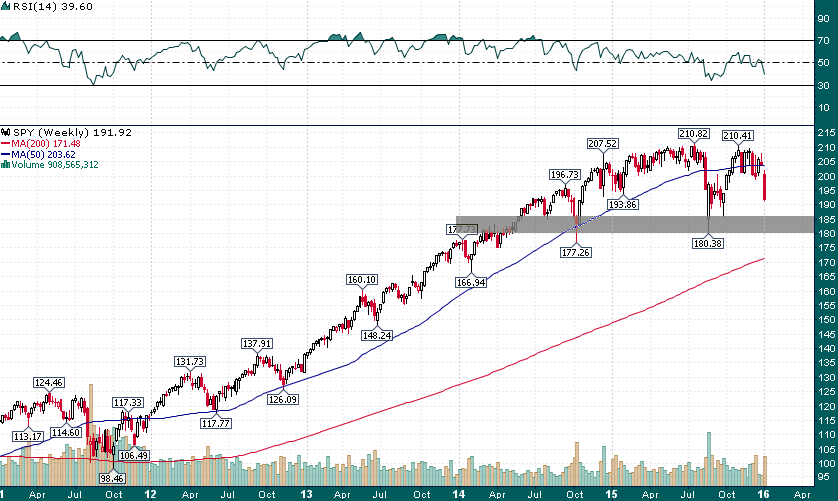
Heading into last week the large/mega cap S&P 500 was barely 4% off its all-time highs from last summer. The next area of major support/resistance still lies another 4%-6% lower.
This is the worst start to the year EVER for the S&P 500, however, as CMT Ryan Detrick pointed out that doesn’t necessarily mean much for the rest of the month or even the rest of the year:
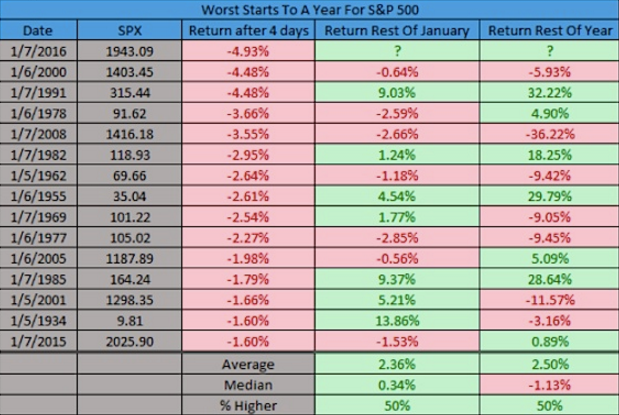
The one observation I will make from this table is that years in which stocks were coming off of recently making all-time highs (2000,2008, etc.) saw further downside during the rest of the year (especially 2008). The S&P 500 is 6 months removed from printing an all-time high at 2134.72….