
The Russell 2000 (IWM) has been testing an important area of resistance for the last few days:
IWM (Daily)
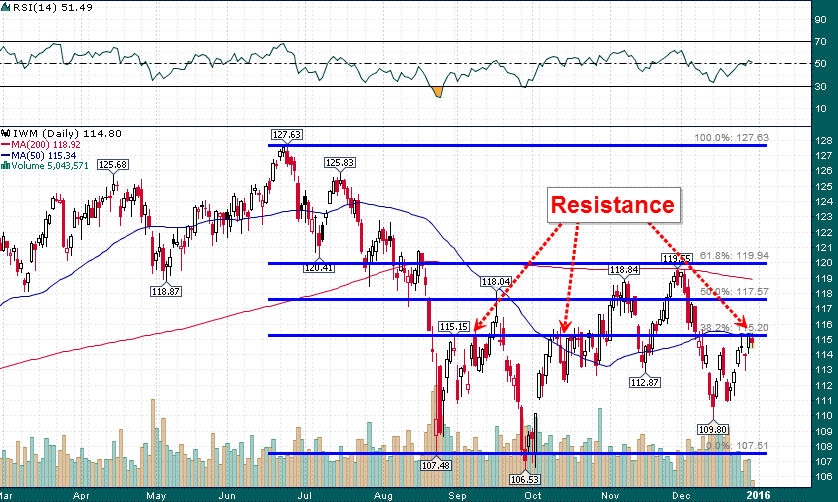
This resistance near $115-$115.20 on the IWM also happens to line up with the flat 50-day simple moving average and the 38.2% Fibonacci retracement of the June-August decline. It is fitting that small cap equities are ending the year testing an important resistance level. We may have to wait for the new year to see some resolution; will we experience the January effect? OR will the recent bounce turn out to be a bearish flag pattern which precedes a much larger decline in the new year?