
Copper has fallen roughly 10% during the month of November and a remarkable 10 consecutive trading sessions:
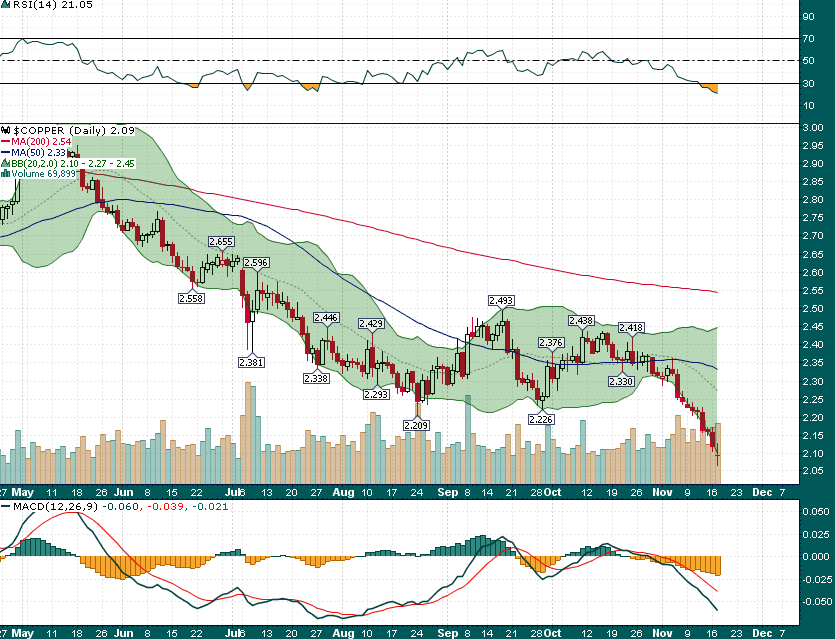
Today’s doji candlestick below the lower 2-standard deviation Bollinger Band could indicate that the downtrend may be coming to an end. However, the break of support near ~$2.20 doesn’t bode well for the intermediate-term trend of copper prices.
Look no further than the following chart for an explanation of why copper has been behaving so poorly:
China official GDP vs.Goldman Sachs China Current Activity Indicator
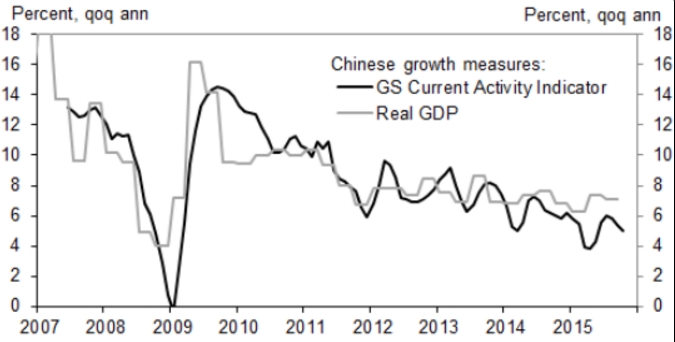
China has been the key driver of copper demand for the last decade and recent data shows that Chinese economic growth continues to disappoint despite what the Chinese government would have us believe. The GS China Current Activity Indicator indicates that Chinese GDP growth is well below the official government numbers. The GS indicator grew at 5.0% quarter-over-quarter, which is a decline from 5.3% in September.