
This is an insightful graph of the 90th percentile gold production cash cost curve dating back to 1990:
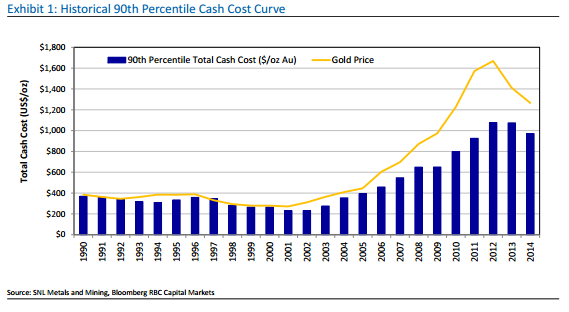
A few takeaways from this graphic:
- Cash costs nearly quintupled during the bull market years 2002-2012 – this was mainly due to an increase in production from lower grade mines and surging energy costs.
- Costs have moved into reverse for the past couple of years after more than a decade of skyrocketing mining costs (costs are expected to fall again this year).
- Gold mining costs are surprisingly closely correlated with the price of gold.
- Gold didn’t fall below the 90th percentile of cash costs during the 90s when gold was very much out of favor as an investment asset – this adds weight to the idea that it will take a lot for gold to fall below $1,000/oz for any extended period of time.