Stocks have gotten whacked in the last 24 hours with the S&P 500 falling more than 40 points from high to low. The daily chart of the S&P (SPY) shows a potential breakdown from a pennant pattern which has formed during the last 6 weeks:
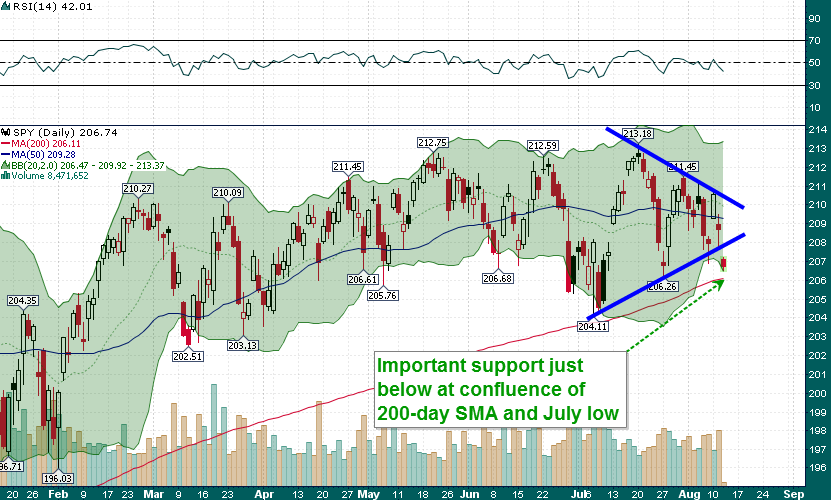
The crucial level to watch lies just below where stocks opened this morning. The $206 level on the SPY (2060 on the cash S&P index) represents the confluence of the rising 200-day moving average (which has not been breached since last October), the July low, and the lower boundary of the 2-standard deviation Bollinger Band.
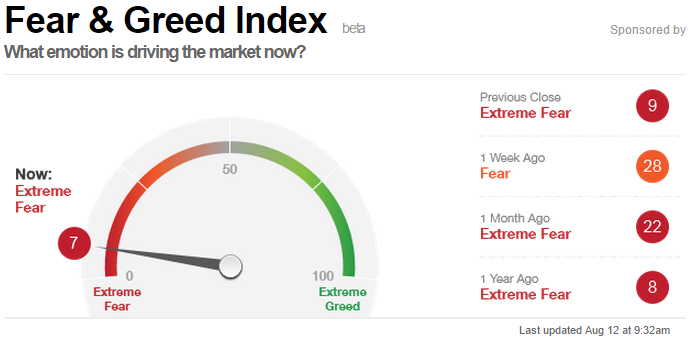
With sentiment already at extreme bearish levels a brief break below the 200-day moving average could be the perfect setup for yet another bear trap and a powerful rip to the upside…