
After drifting lower on light volume for the last month the goldies (GDX) enjoyed their first strong trading session since early May:
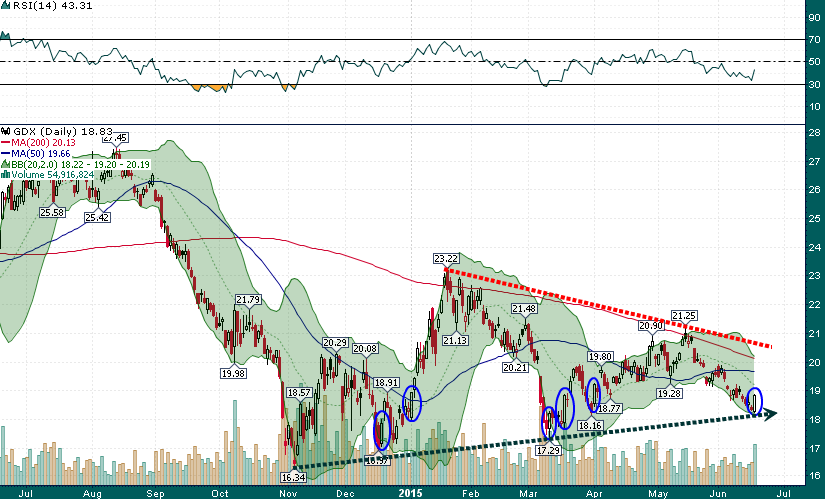
A high volume bullish engulfing candlestick with a close at session highs. As illustrated by the blue circles in the chart above, high volume (above 50 million shares traded) full bodied candlesticks which occur after an extended downtrend have resulted in multi-week rallies during 2015.
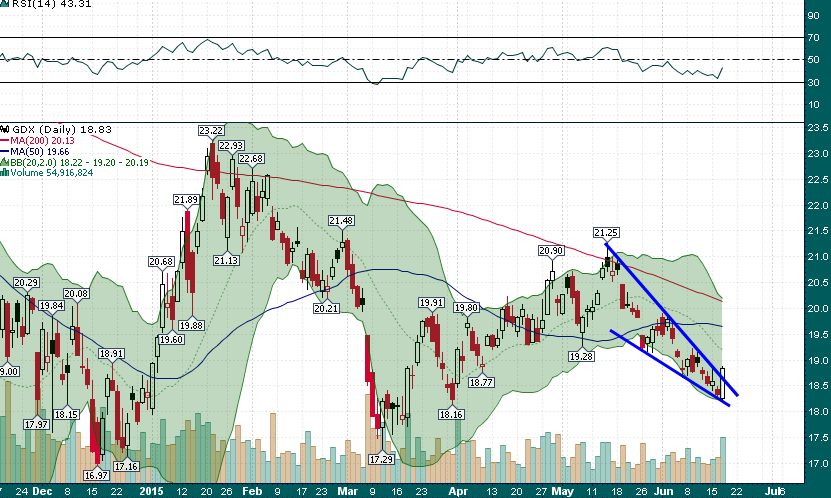
Moreover, today’s rally took place within a whisker of the uptrend drawn from the November low and also triggered a bullish resolution to the falling wedge chart pattern which has formed during the last several weeks:
Bulls will want to see follow through buying tomorrow with considerable potential for a quick return to the $20 ‘center of gravity’ price level. Today’s low now becomes an important downside reference point that can also be used as a stop-loss level for short term trading positions.
As always we will be following GDX closely over the coming days and updating readers with real-time trade alerts in the CHAT.CEO.CA Trading Room where we have already established a not insignificant track record of profitable trading.