
Gold has tumbled more than $50/ounce in the last 8 trading sessions and there is ample cause for concern that the decline isn’t over yet:
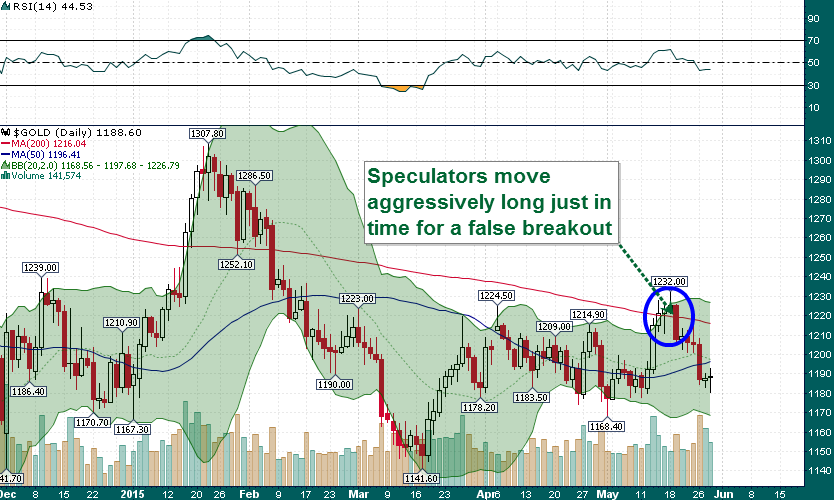
Thus far support at $1180 has held, however, given the number of times this level has been tested in the past couple of months there is a good chance that the $1180 support level will be breached over the coming days/weeks.
Speculators piled into long positions in gold during the week of May 11th as evidence by last week’s CoT Report (Commitments of Traders):
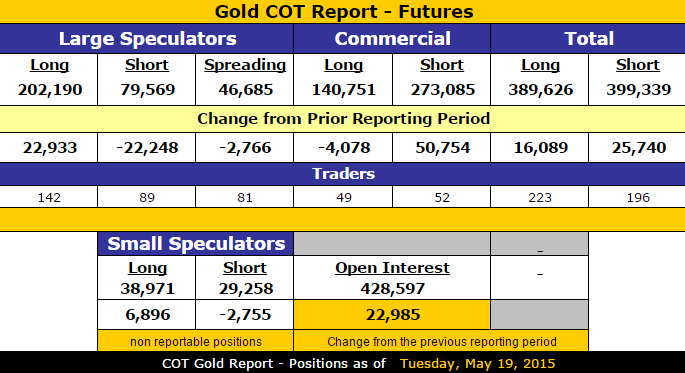
A 50,000 contract increase in the commercial short position within one week is extreme by any measure. Despite the sell-off during the last week, bearish seasonality and the potential for a further unwind of an excessive speculative long position means that gold faces headwinds for the foreseeable future:
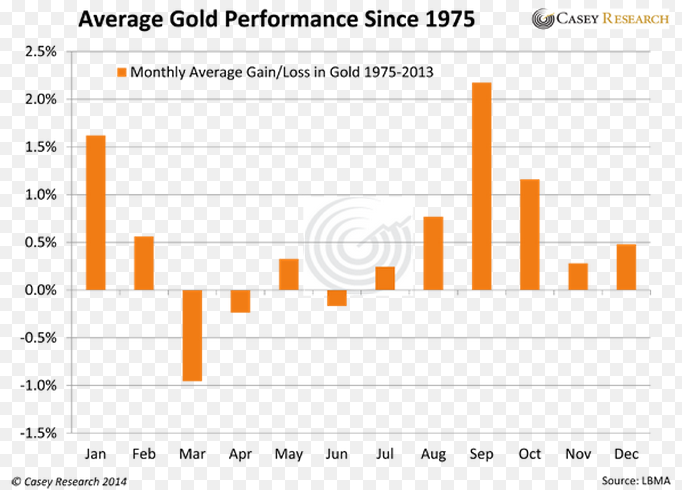
Interestingly enough June was a great month for gold in 2014 as the yellow metal rose by over $75/oz