
How can a .42% sell-off in the S&P 500 be considered bearish? After all, such a small move falls well within the realm of noise. I would almost always not place too much weight in a trading session with such a small net change, however, today’s market action should definitely raise some alarm bells for the discerning market observer for the following reasons:
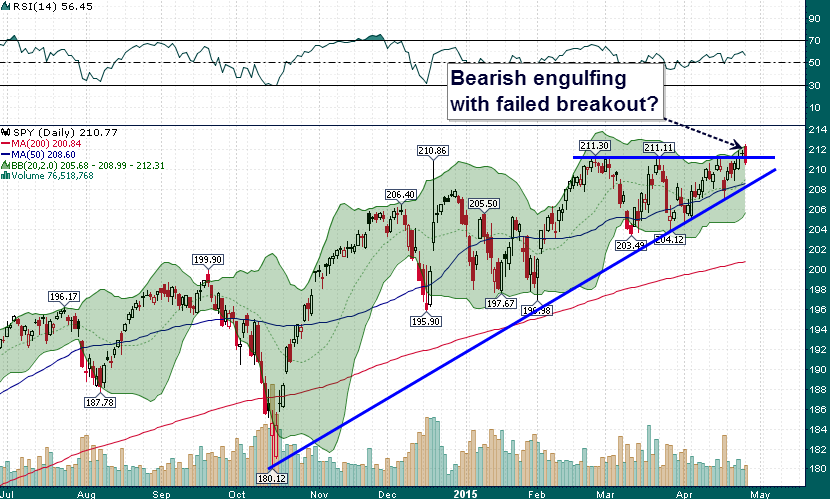
- Equities opened near the high of the session and closed near the lows
- The S&P 500 printed a bearish engulfing candlestick and there is a strong possibility that we just witnessed a failed breakout
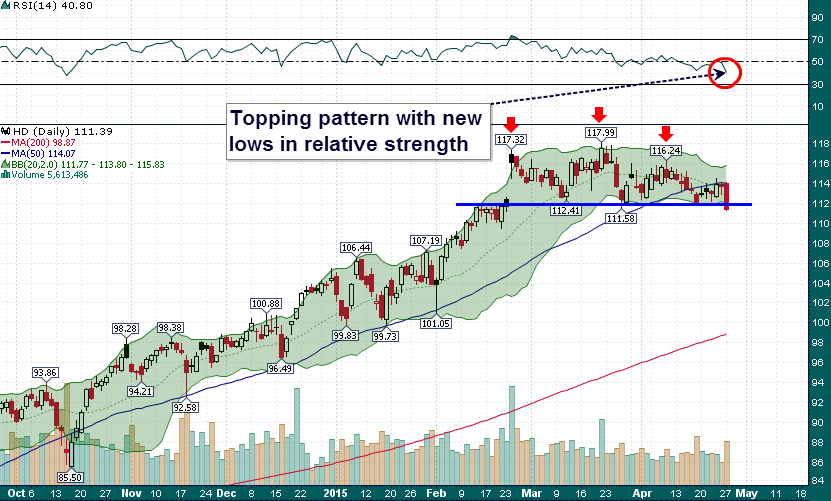
- Housing related stocks look extremely vulnerable after topping out during the past couple of months – mega-cap home retailer Home Depot (HD) is an excellent example:
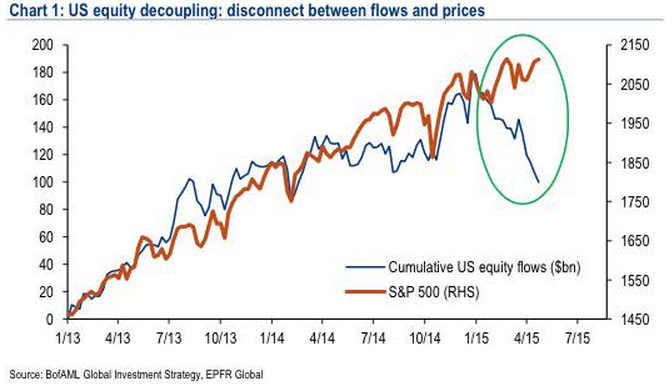
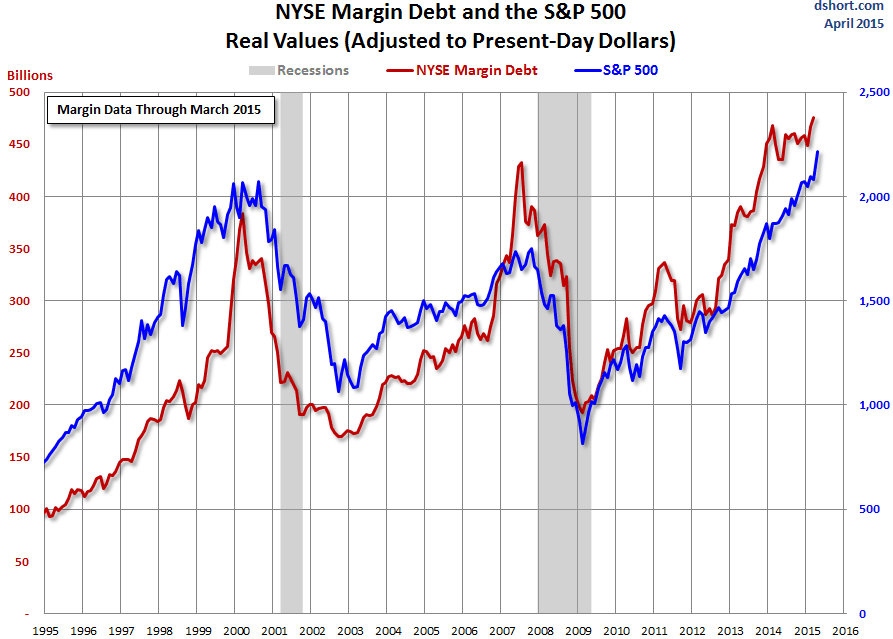
- As equity fund flows increasingly diverge from price action NYSE margin debt increased by over $11 billion in the last month
Increased margin debt usage as fund flows decrease is indicative of an increase in retail investor risk taking (leverage) as overall market participation wanes. This also helps to explain much of the light volume churning we have witnessed in recent months…
- Financials, Home Builders, REITs, Industrials, and Energy did not participate in the push to the recent highs in the past few weeks (in fact many of these sectors fell). This makes this morning’s all-time high in the S&P 500 (2125) possibly one of the weakest ever in terms of breadth & volume.
With May beginning on Friday and an abundance of yellow/red flags popping up all over the place it might be time for equity investors to consider selling in late-April and going away…..