
Daily Commodity Chart Wrap 3/23/2015:
Copper (Daily)
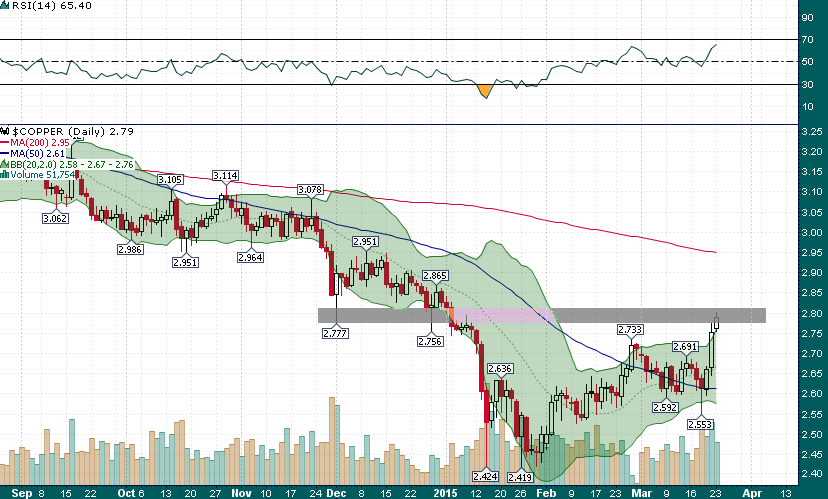
Copper has rebounded nearly 10% in just the past few trading sessions. Price is now testing a cluster of previous support $2.75-$2.80. Above $2.80 the next area of resistance will be $2.95-$3.00.
Copper demand growth forecast
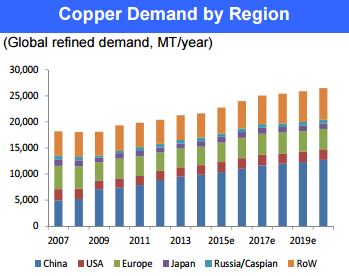
Aluminum demand growth forecast

Aluminum demand growth forecasts are very strong, however, the Dow Jones US Aluminum Index has broken down from a multi-month top in recent weeks:

Gold (Daily)
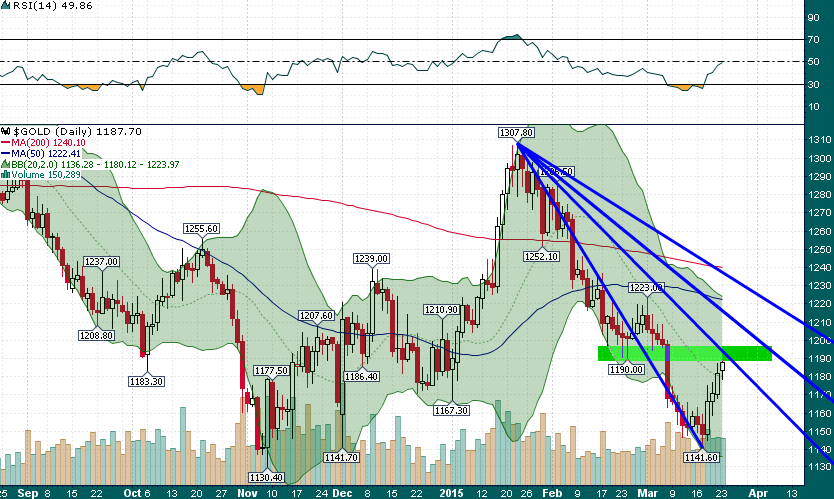
Gold has rallied for 4 consecutive trading sessions and is now testing previous support around $1190 with the big round number $1200 level just overhead.