
Daily Commodity Chart Wrap 2/25/2015:
Copper (Daily)
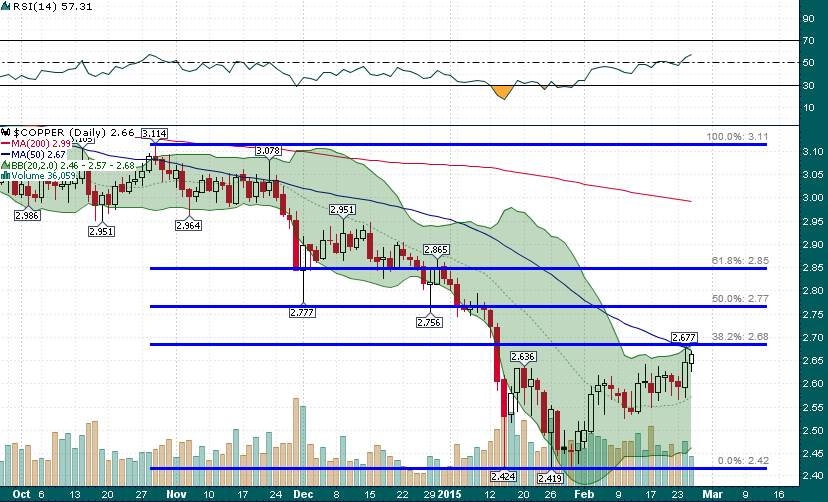
Copper is testing an important confluence level ($2.67-$2.68). The next couple of sessions will be crucial in determining whether the February rally is simply a dead-cat bounce or something more substantial.
Crude Oil (Daily)
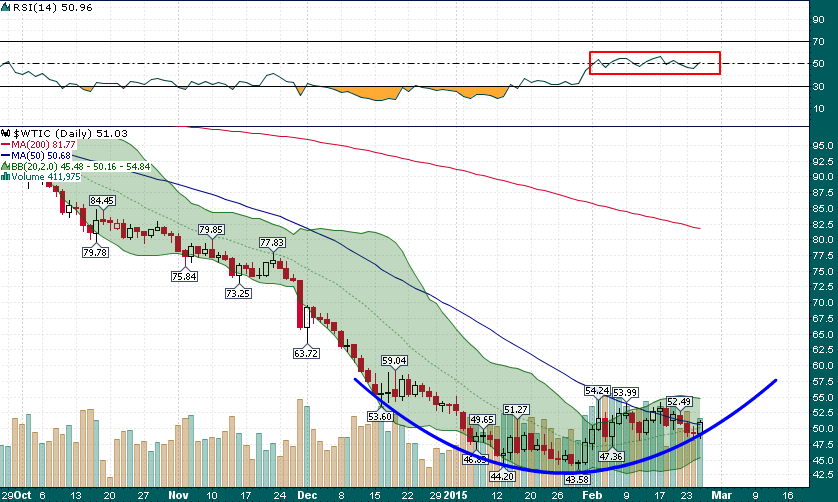
Support near $48-$49 held for the third consecutive session with a strong close above the falling 50-day simple moving average. Notice the daily RSI(14) continues to oscillate around the median line as price remains rangebound between $48 and $54. Resistance remains above at $54 with support below near $49. The rounding bottom interpretation is still in play
Natural Gas (Daily)
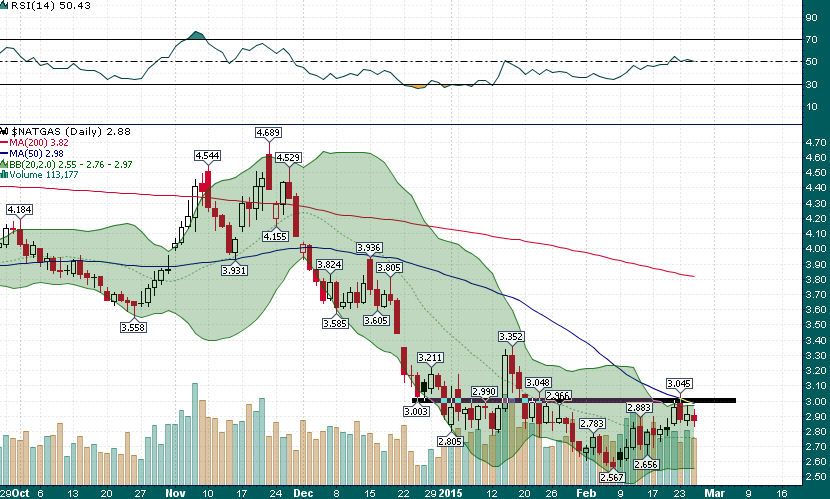
Natural gas ran into resistance above $3.00 (50-day SMA) and has since pulled back to minor support near $2.85. Seasonality is a tailwind for natural gas and a move above $3.00 should lead to a sharp rally to the $3.20-$3.30 area.