
There was a boom in oil & gas Capex during the past couple of years, particularly in the shale oil drilling space:
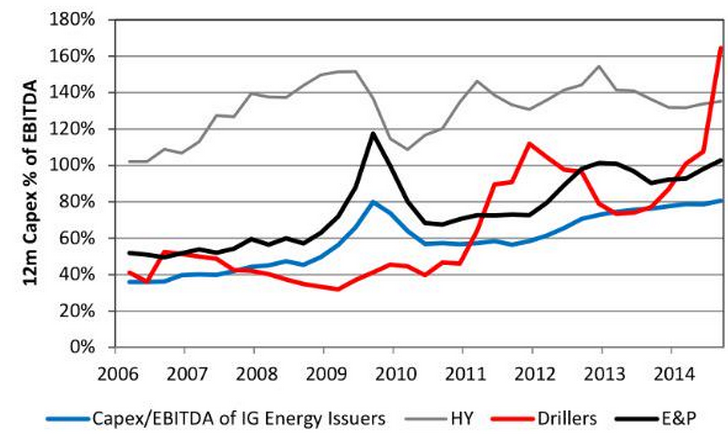
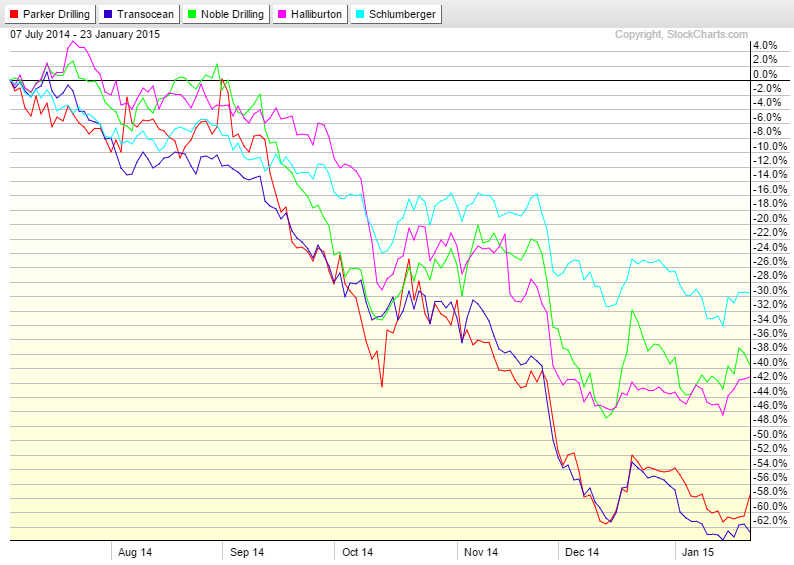
With the recent crash in the oil price this boom has turned into a bust and there is likely to be further fallout among the weaker, less well capitalized players:
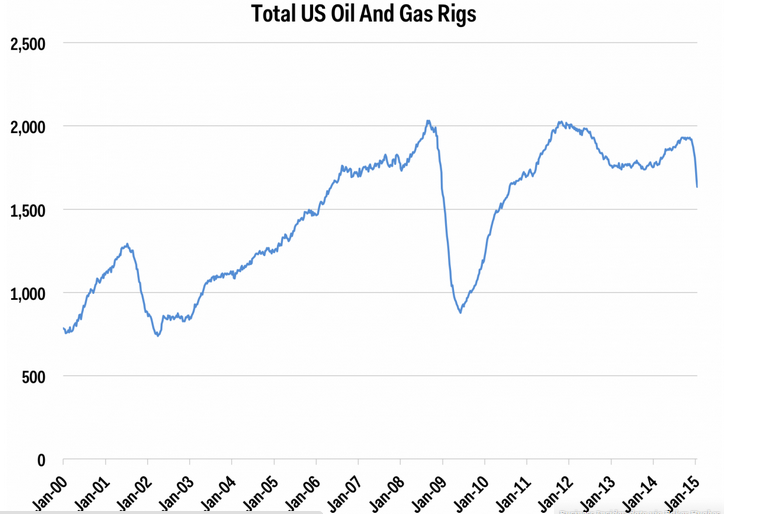
Rig counts have a lag effect due to the time and capital outlay required to shut down and move a rig. However, the trajectory of the drop in rigs during the past couple of months tells us that there is definitely more to come. In fact, the steepness of the recent decline can only be compared to the 2008 drop-off:
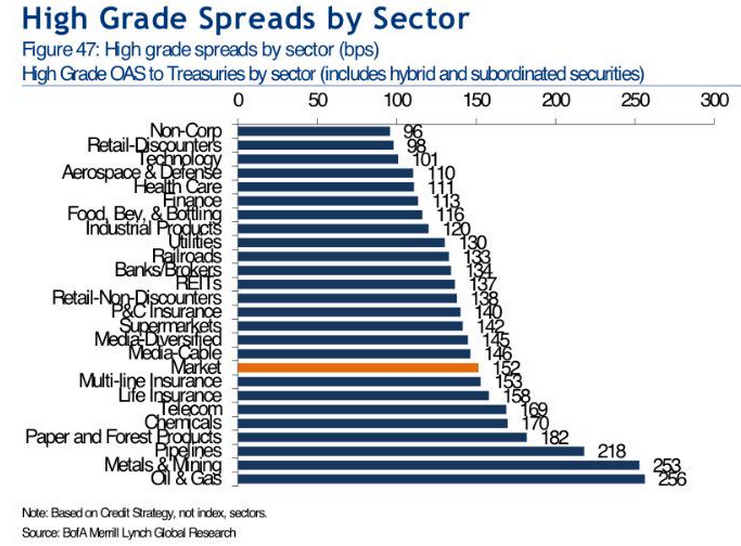
As one might expect oil & gas debt is considered to be the riskiest sector out there currently:
Judging from experience we are in the 3rd or 4th inning of a major correction in the oil & gas space. One which will clearly separate the stronger players from the weaker leveraged players who will almost surely be extinct by the end of 2015.